Custom Feature Descriptor:
The feature descriptor that was implemented is similar to the SIFT feature descriptor. A 16x16 pixel area is first rotated to the orientation of the feature. It is then divided up into 16 smaller 4x4 pixel area around the center point. Then each pixel within the 4x4 area is sampled. The Harris value is sampled along with the direction of the larger eigenvector. The value is then binned into one of the eight bins based on its direction. The histogram bin is then reordered so that the bin with the highest value is the first feature point. The 8 bins are then pushed onto the feature data as data. The same process is then repeated for the other 15 smaller 4x4 area.
Major Design Decisions:
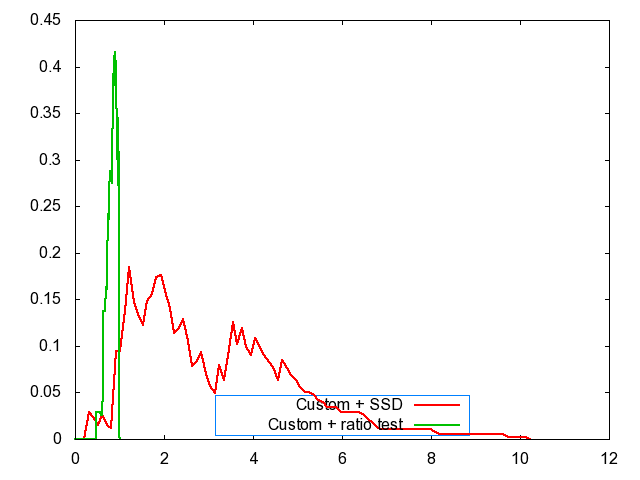
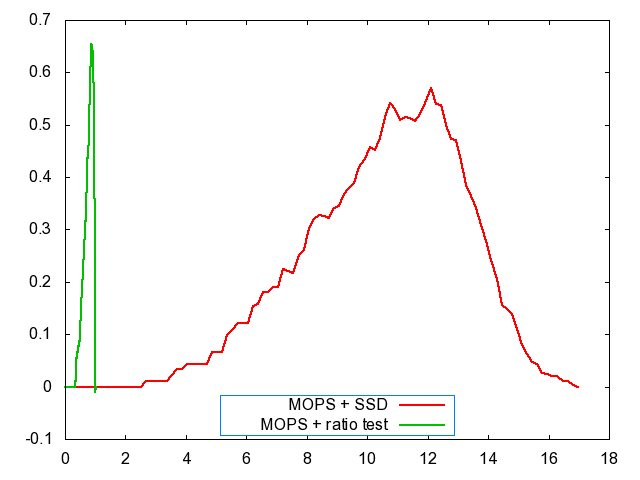
There exists an internal threshold included in the ratio test of 0.85 to differentiate the ratio matching from the SSD matching. Ratio matching with no thresholds would be the same as SSD matching.
The eigenvalue was used over the value obtained from using the Harris operator as it would also give the eigenvectors, allowing us to find the direction of the eigenvectors. Using eigenvalues also would make feature detection more accurate as the Harris operator is only a quick approximation of finding the minimum eigenvalue.
A threshold for feature detection of 0.05 was chosen so that there was not too many features that the program would need to search through. A rule of a local maximum must also be 0.03 above its neighboring features was also implemented to limit the features to �good� features. This however has a drawback on blurry images since the Harris values will be extremely close together. For example, bikes 4, 5, and 6 did not have any �good� features being detected.
Yosemite:
Graf:
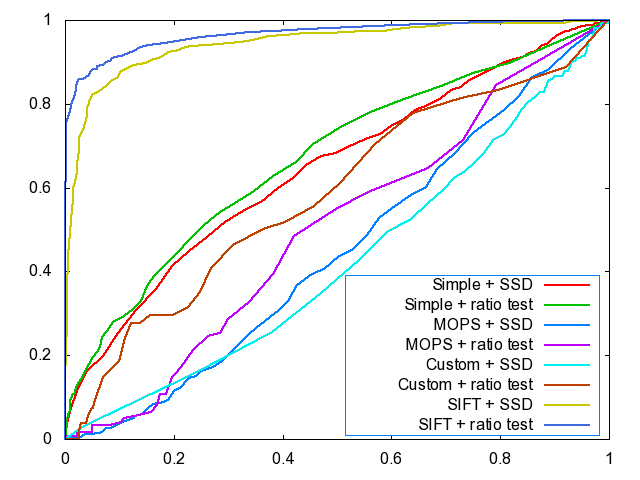
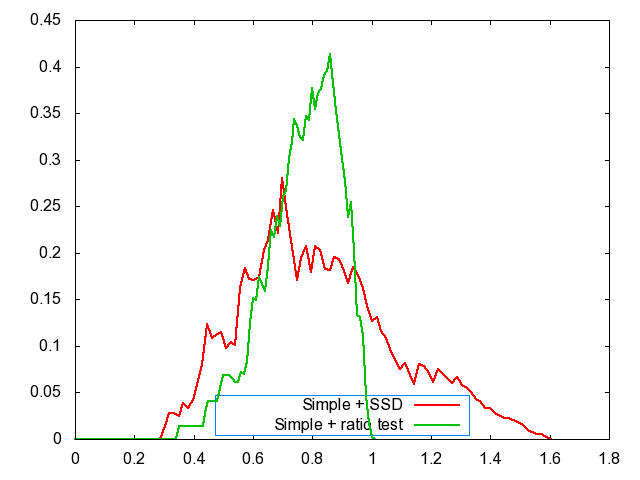
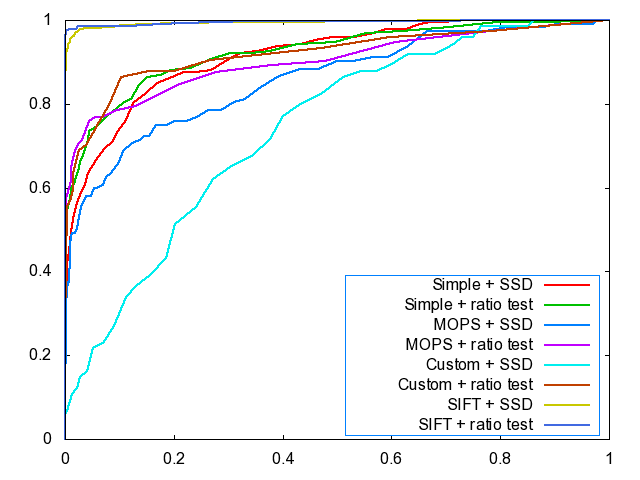
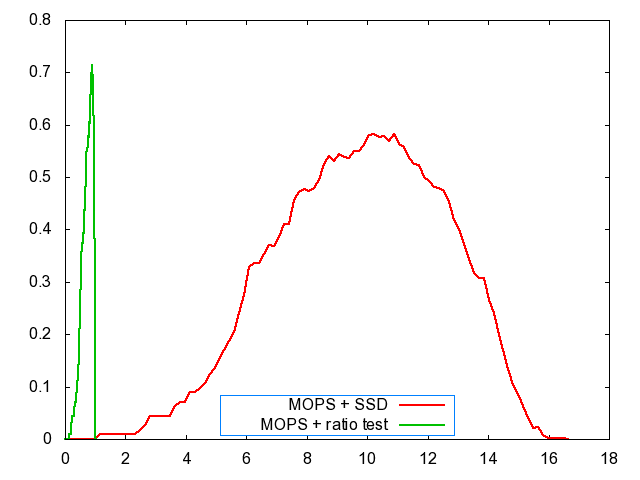
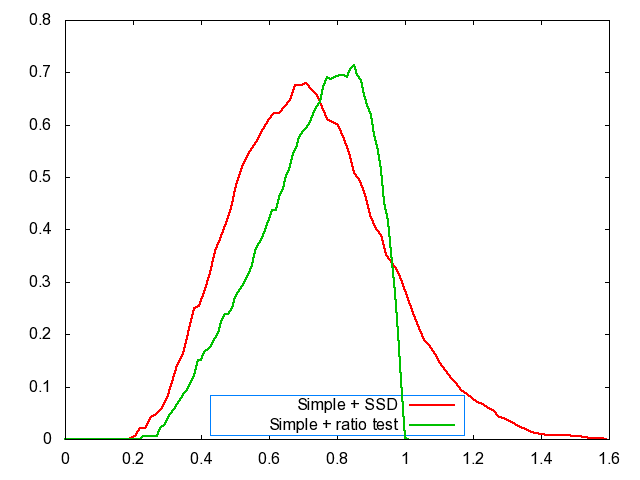
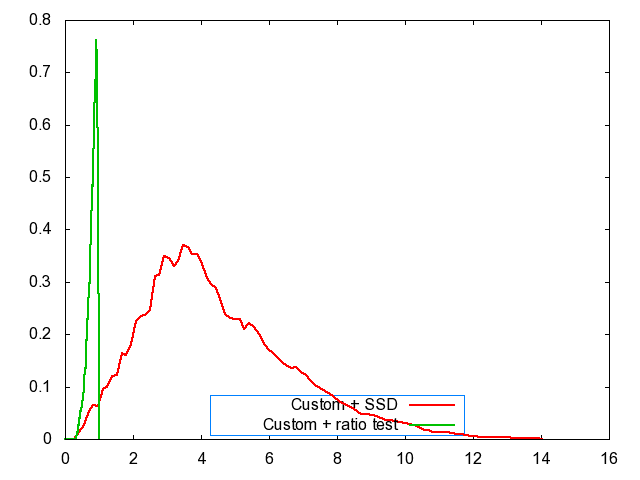
Average AUC: